
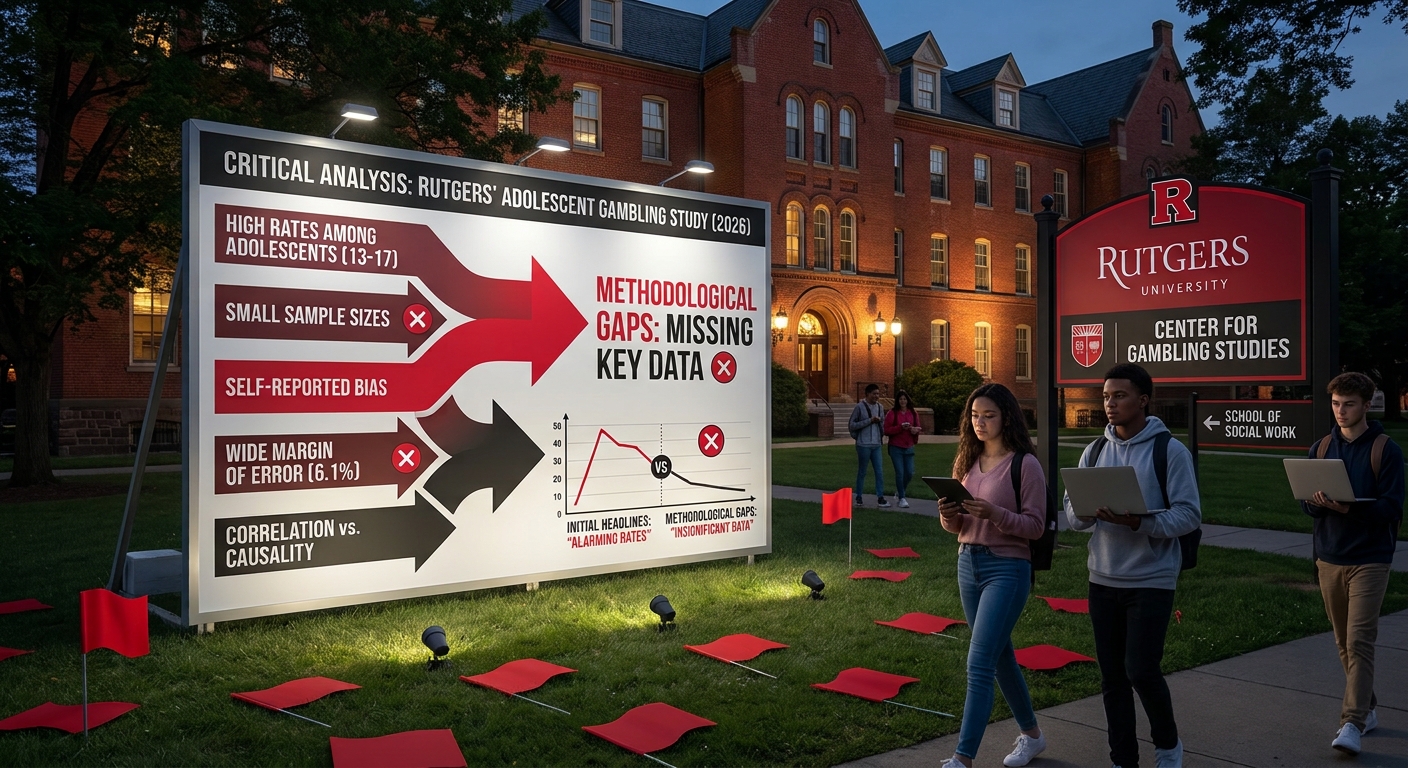
The Rutgers study on teen and young adult gambling habits got a lot of attention two weeks ago when it first was issued, and it made some interesting conclusions, even though I immediately saw some flaws in the report and the framing of it on social media.
Nothing I say below is meant to diminish the harms of gambling or the role of expansions to those numbers, but this is a 40-page report that tells us very little that previous studies haven’t already said. So just to reiterate: Teenage gambling is a serious problem, but I’d stop short of framing it as a crisis.
Before I dive into the findings, I need to post my usual caveat about studies and surveys, because it’s always about methodology and what isn’t included in the final report.
On Methodology
The study, Adolescent and Young Adult Gambling in the United States, is a national survey of U.S. teens and young adults ages 13 to 27, conducted by the Center for Gambling Studies (CGS) at Rutgers University using NORC’s AmeriSpeak Panel.
Here are a few things to consider:
- The final sample consisted of 1,677 completed interviews (509 teens and 1,168 young adults). The teen number is a little too low to provide clear analysis of that subgroup, in my opinion (a 6.1 percent margin of error per the report).
- Participants were paid a small amount ($5-$7 for participating), but the median survey completion time was only 14 minutes.
- The results were self-reported.
On Definitions
I would also like to know how they defined some of these activities to respondents. The report has a glossary with some vague and some detailed definitions, but it doesn’t provide the framing of the questions.
And since the survey asked about a wide range of gambling and gambling-related activities, without seeing the exact wording it’s hard to know how respondents understood “gambling” for things like bingo, social sports betting, and games of skill, and if that crept into their responses for other categories.
On the Framing of the Results
The framing of the findings certainly made it seem like we are in the midst of a brewing epidemic of teen gambling, but the study was basically in line with previous studies, once we look at two things:
- The definitions of the gambling activities
- The framing of the findings
Why are we including school raffles and family bingo games in the same bucket as sports betting and slot machines? Notice bingo and raffle ticket participation go down with age:
Figure 9
Sex and Age Group Differences Among Common Gambling Activities
Percent participating in the past year, by age group.
Source: Rutgers Center for Gambling Studies, Adolescent and Young Adult Gambling in the United States (NORC AmeriSpeak Panel).
So I have a lot of issues with the top-line number saying 42.7 percent of 13-17-year-olds participated in a gambling activity over the last year, when there is a world of difference. Some of these activities could technically be considered gambling, but would not be overly concerning. Particularly when we consider that most of the reported usage among teens happened less than once a month, meaning it could be a once a year occurrence—parents or grandparents giving kids scratch tickets around the holidays or a March Madness bracket. I’ll leave the debate over whether these activities are problematic or harmless fun for another day.
This would be like an alcohol usage survey trumpeting high numbers because teens report drinking a flute of champagne at a wedding or having wine at a family gathering.
To its credit, the report does mention this prominently in its summary and recommendations, but that caveat was missed by most of the reporting on the findings:
“It is important to recognize that many of the activities reported by adolescents, including raffles, bingo, and games of skill, may occur in informal or socially sanctioned settings with family and friends, rather than through regulated gambling operators. The study did not establish whether underage respondents accessed regulated platforms, participated in unregulated or offshore gambling, or gambled informally at home or school.”
The Biggest Issue
The chart that really caught my attention, and was one of the most common “look at this!” responses on social media, was the Gambling Frequency by Activity, which, out of context, makes it look like we have a significant problem on our hands:
Table 3
Gambling Frequency by Activity
Weighted % of participants in each activity; unweighted n in parentheses. Sorted by share gambling weekly or more.
| Activity | Weekly+ | 1–3x/mo | <1x/mo |
|---|---|---|---|
| Prediction markets | 31.7 | 38.9 | 29.3 |
| Keno | 25.0 | 30.6 | 44.4 |
| Street games | 23.0 | 37.1 | 39.9 |
| Daily fantasy sports | 20.7 | 42.2 | 37.0 |
| Social sports betting | 20.1 | 48.1 | 31.8 |
| Season-long fantasy | 20.1 | 36.1 | 43.8 |
| Sports betting | 18.4 | 31.0 | 50.7 |
| High-risk stocks | 15.9 | 30.0 | 54.2 |
| Social casino games | 15.8 | 34.6 | 49.6 |
| Games of skill | 11.2 | 33.2 | 55.6 |
| Lottery | 9.8 | 25.6 | 64.7 |
| Activity | Weekly+ | 1–3x/mo | <1x/mo |
|---|---|---|---|
| Cryptocurrency | 9.5 | 38.5 | 52.0 |
| Bingo | 9.2 | 20.9 | 69.9 |
| Scratch-off tickets | 7.7 | 26.9 | 65.4 |
| Esports betting | 7.5 | 47.3 | 45.2 |
| Poker | 5.7 | 26.7 | 67.6 |
| Video poker (129) | 5.7 | 34.0 | 60.3 |
| Slots (266) | 5.3 | 20.6 | 74.1 |
| Raffle tickets (314) | 3.9 | 19.1 | 77.1 |
| Casino table games (149) | 3.1 | 24.5 | 72.4 |
| Horse racing (62) | 1.4 | 18.8 | 79.8 |
Source: Rutgers Center for Gambling Studies, Adolescent and Young Adult Gambling in the United States (NORC AmeriSpeak Panel).
Once I saw this chart I immediately said, “Hold on a minute,” because there is a column missing: People who don’t participate in the activity.
Why are we looking at frequency from active bettors and not the entire sample size? Particularly when some of these activities were uncommon among respondents:
Figure 4
Past-Year Gambling Participation by Activity
Weighted % among those who gambled in the past year (unweighted N = 887).
- Scratch-off tickets45.8
- Bingo37.2
- Lottery37.2
- Raffle tickets34.7
- Slots27.9
- Games of skill26.9
- Sports betting20.7
- Season-long fantasy sports18.4
- Casino table games15.4
- Video poker15.0
- Cryptocurrency trading14.6
- Poker13.3
- High-risk stocks12.9
- Social sports betting9.8
- Social casino games8.5
- Esports betting8.3
- Daily fantasy sports7.3
- Prediction markets6.6
- Horse racing5.8
- Street games5.2
- Keno4.2
activities
Source: Rutgers Center for Gambling Studies, Adolescent and Young Adult Gambling in the United States (NORC AmeriSpeak Panel).
Per the study, only 6.6 percent of respondents use prediction markets, yet looking at the frequency chart, one would think this is the worst of the worst, with the highest percentage of weekly users. But the actual number is 31.7 percent of 6.6 percent, or ~2 percent of respondents use prediction markets weekly.
The esports betting percentage was 8.3 percent, with 7.7 percent of esports bettors participating at least weekly, which works out to ~0.6 percent engaging in it weekly.
Additionally, like every other gambling study, I find it hard to wrap my head around the way bettors are classified as “at risk” based on their PGSI score: A score of 0 is no-risk, 1-2 is low-risk, 3-7 is moderate risk, and 8+ is high risk. That moderate risk category is far too wide. Put another way, someone scoring a 3, one step beyond low-risk, is classified the same as someone scoring a 7, one step away from high-risk.
PGSI score bands as used in the study.
On the PGSI
I’ve written about the problems with using the PGSI, a self-assessment tool that measures a person’s likelihood of having or developing a gambling disorder, in a 2023 column:
“Landing in the low end of the medium risk category isn’t too hard if you gamble with any regularity. And because of the questions, certain forms of gambling tend to score higher. Sports betting will likely cause more stress/anxiety than slots, and poker players routinely borrow money and increase stakes.”
Or, as I said back in a different 2023 column:
“The bad ideas stem from one of the big misconceptions in the space, that a questionnaire or a specific assortment of betting behaviors can spot gambling disorders. Those things are certainly helpful, but it’s way more complicated than that.”
Beyond the Headline: A Previous Study On Young Adults and Sports Betting
A study on Massachusetts sports betting conducted by NORC (the National Opinion Research Center) at the University of Chicago and funded by the Massachusetts Gaming Commission, provides an interesting look into the mind of sports bettors.
The report, titled, “Perspectives on Sports Betting among Young Adults in Massachusetts: A Community-Engaged Research Study,” is part of a multi-phase research project looking at how legalization of sports betting in Massachusetts has shaped the views, behaviors, and experiences of young adults ages 18–25.
Methodology
First, unlike most research projects, this was not a wide-scale study, so take all findings with a grain of salt, but also, good on the MGC for funding a different approach.
Instead of surveying 1,000-plus people, researchers took more of a scalpel approach:
Here’s what the report found.
Normalization as Entertainment
Per the report, young adults overwhelmingly frame sports betting as low-risk, casual entertainment rather than “gambling.” And while they recognize potential harms they tend to view problem gambling as something that happens to other people. Unsurprisingly, the use of responsible gambling tools and problem gambling resources is low.
STTP ThoughtThe above all likely stem from the industry’s framing of gambling (when done responsibly) as entertainment. I don’t need to use RG tools, those are for other people. Basically, sports betting is harmless fun… until it’s not.
Underage Access Is a Problem
As the report notes, betting among 18–20-year-olds (particularly males) is common despite age restrictions. Workarounds include shared parental accounts, VPNs, offshore sites, and informal betting among peers.
Upshot
Everyone, including me from time to time, likes to rag on poll results and academic research. Especially the ones we don’t like. But when poll after poll and study after study all point in the same direction, maybe it’s time to stop being Principal Skinner: “Am I so out of touch? No, it’s the polls who are wrong.”
Straight to the Point provides no-nonsense analysis of the day’s most important gambling industry news.
Steve Ruddock is a gambling industry analyst and advisor and the founder of Straight to the Point.